New version of Exchange Message Log Reporter v2.0 to report on traffic statistics of mail transactions.
Generate Exchange traffic reports for all kinds of email traffic – mailbox traffic, traffic to distribution groups etc. – based on email count and size. The email traffic reports include:
- Top Senders by Mail Count report
- Top Senders by Mail Size report
- Top Senders by recipient count report
- Top Senders to Distribution Groups by Count report
- Top Senders to Distribution Groups by size report
- Top Recipients by Mail Size report
- Top Recipients by Mail Count report
- Top Distribution groups by received mail count report
- Top Distribution groups by received mail size report
- Mail count by server host name report
- Mail count by client IP report
- Mail count by Subject report
- Mail count by size range report
- Mail count by custom size range report
- Mail size by Subject report
- Mail size by Client IP report
Various options are available to deliver these graphs to the end user or the management (as in the earlier version): Export (XLS/MDB/TIFF/HTML/CSV/PDF), Print, E-mail (instantly notify different users).
An interesting feature in this new version is the option to generate graphical reports (Bar charts) including the usual tabular format reports. In addition, you can schedule Traffic Statistics report to run at specified time intervals.
Here are a few screens illustrating the new features:
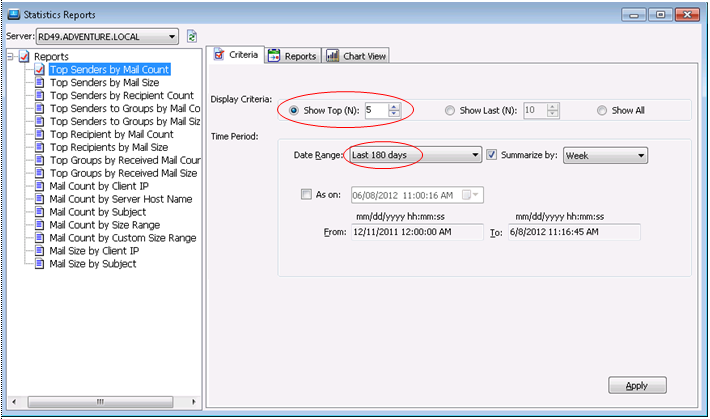
Figure #1: Generate report on the Traffic Statistics of the mail transactions – Choose the report & Specify report criteria
Here, the criteria specified picks the top five Senders by ‘Mail Count’ tracked in the recent 180 days.
Figure #2: Reports summary
A report summary on the ‘Top Senders by Mail Count’is shown below:
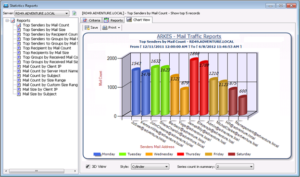
Figure #3: Bar Chart (2D view)
Click the ‘Chart view’ to display a graphical representation of the above report. Default view is two-dimensional. Check the ‘3D View’ box at the bottom for a three dimensional view and choose the bar chart style as desired.
Figure #4: Task Scheduling – Select Exchange Server & Report
The Exchange Server mentioned is ‘RD49.ADVENTURE.LOCAL’ and you can check one or more report(s) to run multiple reports at the same time.
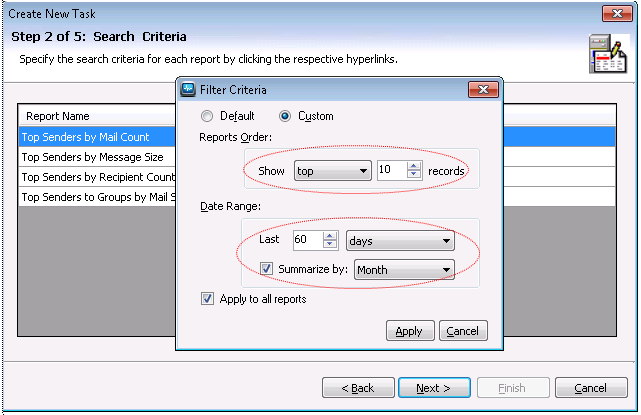
Figure #5: Specify search criteria
Filter the report to display the top 10 records tracked within the recent 60 days and summarize the results by month. Other available options are ‘by day of a week’, ‘by week’, ‘by month’, ‘by quarterly’, ‘by half yearly’ or ‘yearly’.
Figure #6: Schedule the task
The task ‘Sample Test’ is scheduled to run daily at 06.54 PM.
Figure #7: Task summary
This wizard shows the task summary listing the multiple ‘Statistics Reports’ scheduled to run at a specified time interval.
For more information about Exchange Message Log Reporter, visit https://www.vyapinsoftware.com/products/exchange-audit/exchange-server-reporting
If you need exchange online mailbox traffic reports – try Office 365 Mail Traffic Statistics Reports


