When IT Administrators access Office 365 to create or edit users, assign admin roles to other users, reset user passwords, manage user licenses, manage different types of groups and manage domains and so on among other things, they are constantly looking for reports that will allow them to carry out their routine and critical tasks effectively without errors or corrections.
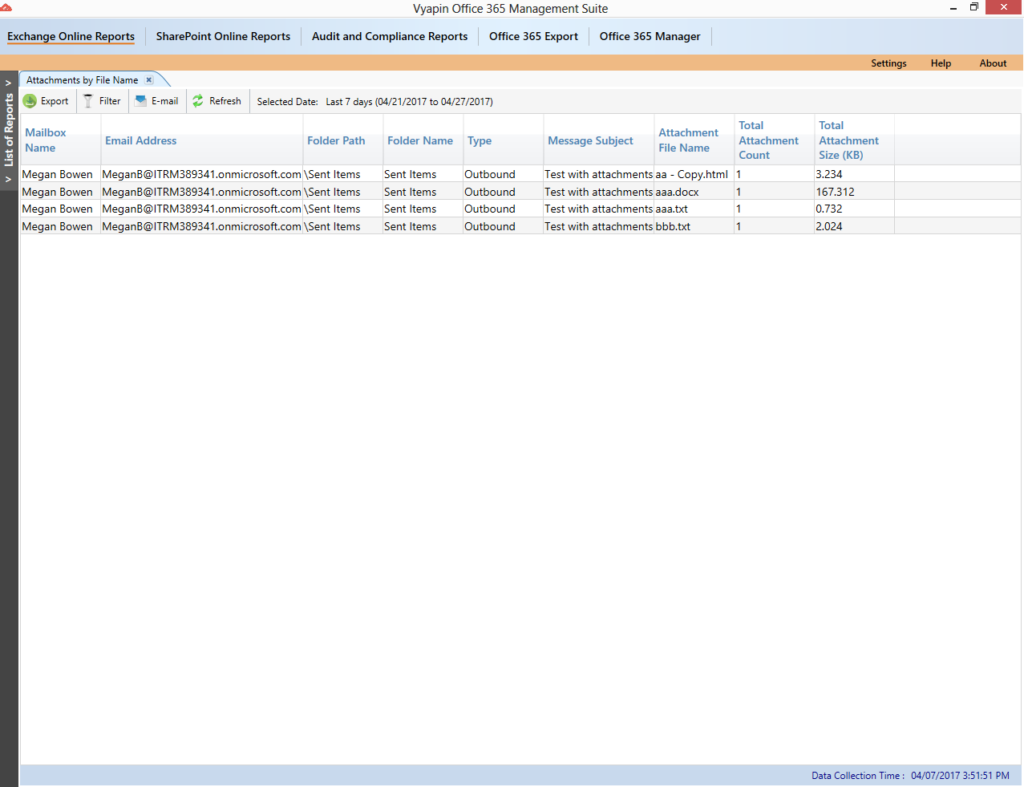
An administrator managing the Office 365 would find the Dashboard reports in Vyapin Microsoft 365 Management Suite very handy as it offers a wide range of reports on users/groups created or changed, password changes, connected mobiles devices, shared devices, mail traffic statistics and more. All the reports were displayed both as chart and text data table.
Brief introduction to Office 365 Dashboard reports:
Top Users by Mailbox Size:
This report displays the top 10 users based on mailbox item size. The mailbox size is a good indicator of how loaded the mailboxes are turning out to be and helps plan archiving and backup measures with respect to all users by studying the size usage of the top 10 users. It also helps pinpoint users with abnormal mailbox usage activity. Additionally, other information related to the user such as user’s login time, logoff time, deleted item count, mailbox type are also shown here. These columns give sufficient information about current activities of the user.
Top Users by Mail Count:
This report displays the top 10 users with highest mail count. The mail count is a good indication of a user’s Office 365 usage and helps analyze the user with respect to his job function. One can find user’s name, login time, logoff time, deleted item count, mailbox type in this report.
Top Senders and Receivers by Mail Count:
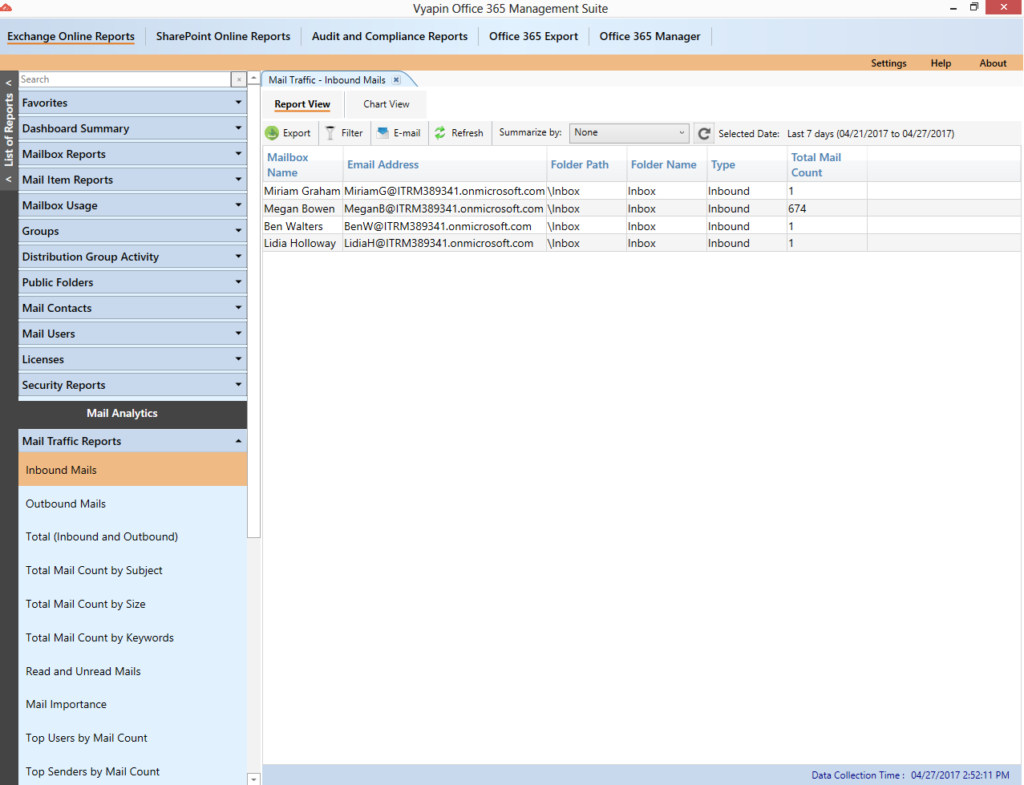
Mail traffic is a major indicator of Office 365 usage by users within an organization. Depending on the nature of the business, the number of mails sent or received by users every day indicate to some extent the productivity and business prospects of the organization. The Top Senders and Receivers report shows which user is sending or receiving the most mail in your Office 365 Environment over a given time period.
Top Senders and Receivers by Attachment Size:
This report displays the top 10 users with the highest attachment size. Though review of attachment sizes is more for the administrator’s need to track mailbox size and analyze traffic, it is also a good monitor to address security concerns in cases of sudden surge in a user’s mail attachment activity. The total attachment size of the user mailbox is calculated and are displayed along with the username.
Active and Inactive Mailboxes:
All the active and inactive mailboxes in your office 365 environment are displayed in this report. The report is displayed in a pie chart format as well as in a tabular format. By default, the report will show active and inactive mailbox in the past 15 days. You can change this date period by selecting a different range of days from the dropdown available above the pie chart. Other information such as username, login time, logoff time, item count, deleted item count, total item size are shown here.
Inbound and Outbound Mail Traffic:
This report shows the number of mails moving in and out of your Office 365 environment classified by the Event type. Each mail received is filtered for any Spam and Malware content. If a mail is found to be clean, it is labeled as “Good Mail”. The report displays mail count categorized by Event type and date. Information fields such as Organization name, domain, received date, event type and mail count are shown here.
List of Groups/Distribution Groups:
This report lists all Groups, Security groups and Distribution groups available in your office 365 environment. Other information fields related to the group such as Group name, identity, recipient type, recipient type details, created and modified date are shown here.
List of Mobile Devices:
This report displays a list of users who have accessed their office 365 mailbox through mobile device using Active Sync. The report displays a detailed information of each connected mobile device with information such as device OS, manufacturer, device model, first time sync date, mobile number, among others.
Recently added Users/Groups:
Users and Groups are usually created in bulk at the time of setting up your tenant and subsequently, more users and groups are regularly added to your Office 365 tenant. This report helps the administrator to view those users and groups which are created in the recent past. This is an important and useful report as users and groups may be created by different people with Admin roles at different times and an administrator must review this report for security and licensing purposes. By default, the report will show the users/groups added in the past 90 days. You can change this by selecting a different day range from the dropdown.
Recently Deleted Users:
This an important report that shows users who were recently deleted from your Office 365 tenant. For security purposes, it is important to maintain an audit trail of all deleted users in the recent past and verify these users with the deprovisioning policies of the organization. Other information related to this report such as user name, first name, last name, city, address, deletion date are displayed in this report. By default, the report will show the users deleted in the past 15 days. You can change this by selecting a different day range from the dropdown.
Please visit https://www.vyapinsoftware.com/office-365-management-tool to know more about our tool.


